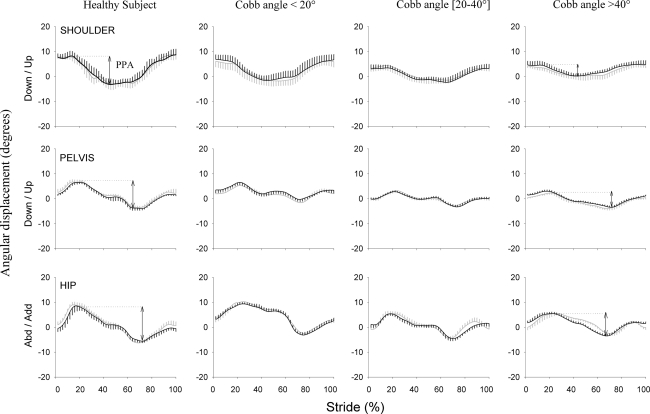
Fig. 2.
Typical trace of shoulder (upper graphs), pelvis (middle graphs), and hip (lower graphs) kinematics in the frontal plane for a normal subject and a patient with idiopathic scoliosis selected from each subgroup. Angular displacements (°) are expressed as a function of the normalized gait cycle (%). The mean (±SD vertical bars—n = 10 consecutive strides) angular displacement is plotted in black for the left side of the normal subject and the convex side of patients. The mean (±SD vertical bars) angular displacement is plotted in thick gray for the right side of the normal subject and concave side of patients. The arrow represents the peak-to-peak amplitude of each joint, i.e. the maximum minus the minimum position

