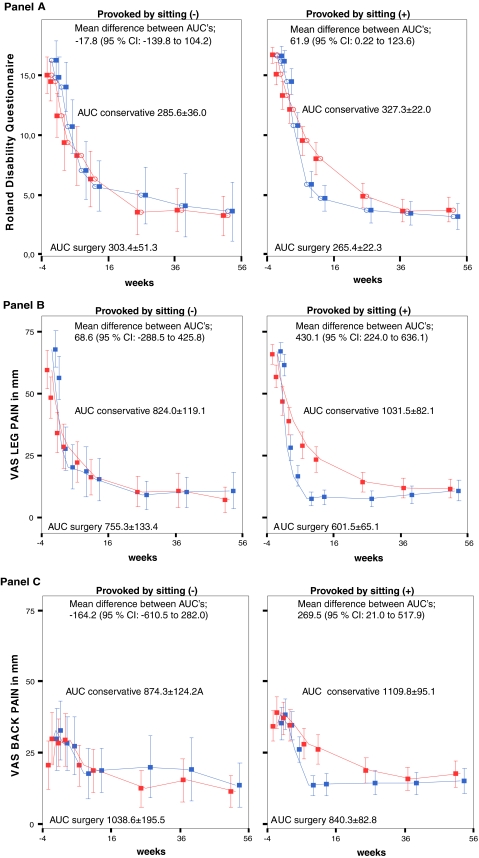
Fig. 2.
Repeated measurement analysis curves of mean scores for Roland Disability Questionnaire (panel a), leg pain (panel b) and back pain (panel c) on a visual analogue scale stratified for “sciatica provoked by sitting (the mean difference between areas under the curves are expressed by the corresponding 95% CI). All three panels show the 52-week curves with 95% CI represented by vertical bars at consecutive moments of measurement. Red lines represent the conservative treatment group, while the blue lines represent early surgery. Areas under the curve (AUC) are described by their mean ± SE. Panel a represents the mean disability scores at consecutive moments of measurement stratified for sciatica provoked by sitting. The overall difference between the areas under the curves over 12 months is not significant for sciatica not provoked by sitting (P = 0.77) and significant for provoked by sitting (P = 0.05) in favour of early surgery. Panel b represents mean visual analogue scores for intensity of leg pain in millimetre. The difference between the mean AUC’s is not significant for sciatica not provoked by sitting (P = 0.70) and significant for sciatica provoked by sitting (P < 0.001) in favour of early surgery. Panel c represents mean visual analogue scores for intensity low back pain in mm. Starting with a lower intensity score when compared to leg pain, the mean AUC’s exhibit no significant difference for sciatica not provoked by sitting (P = 0.47) and significant for sciatica provoked by sitting (P = 0.03)

