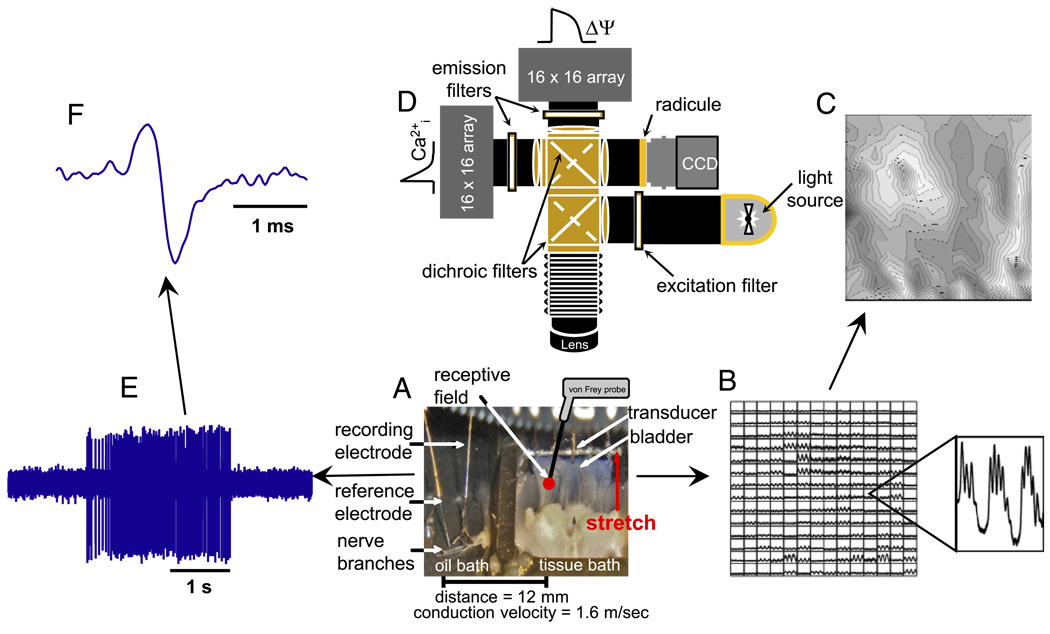
Figure 1.
Experimental setup to record intracellular Ca2+ signals, tension and single unit afferent nerve activity. A, bladder-nerve sheet preparation. B, Ca2+ signals recorded in tissue using photodiode array. C, isochronal map derived from data in B. Initiation site corresponds to imaged tissue region with earliest Ca2+ transients (white areas). D, optical system arrangement of light source, filters, photodiode array and charge coupled device cameras. E, single unit afferent recordings. s, seconds. F, expanded single unit recording from E. ms, millisecond.

