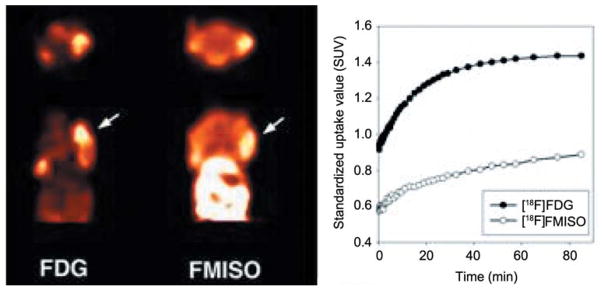
Figure 5.
PET Imaging of CAL-33 tumors in nu/nu mice ([18F]-FDG vs. [18F]-FMISO). Representative summed microPET images taken 40–90 min post-injection of radiotracer, with arrows indicating the location of the tumor. Representative time-activity curves of tumor uptake in mice bearing tumors following injection of [18F]-FDG and [18F]-FMISO. Data are expressed in terms of standardized uptake values (SUV).

