
Fig. 7.
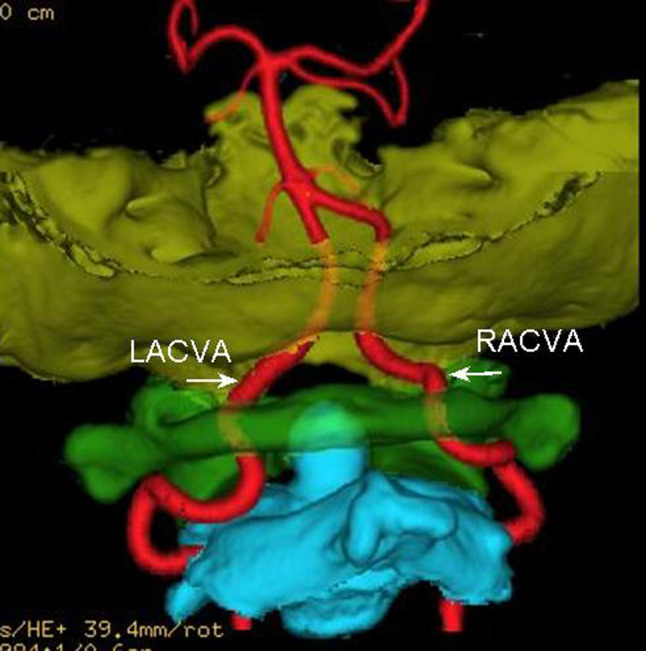
3D image view from back to front with the SFOFC, showing the abnormal courses of CJVA (the white arrow and LACVA and RACVA label)
Official websites use .gov
A
.gov website belongs to an official
government organization in the United States.
Secure .gov websites use HTTPS
A lock (
) or https:// means you've safely
connected to the .gov website. Share sensitive
information only on official, secure websites.
3D image view from back to front with the SFOFC, showing the abnormal courses of CJVA (the white arrow and LACVA and RACVA label)