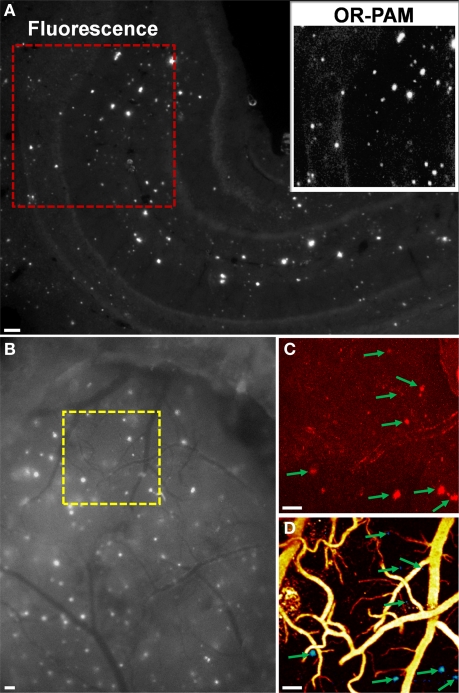
Figure 5.
(A) Entire hippocampus of a Congo red-stained brain section from a 10-month-old APP/PS1 mouse imaged using conventional fluorescence microscopy. Inset: OR-PAM image of the red-boxed region for comparison. (B) Exposed cortical region of a Congo red-injected 10-month-old APP/PS1 mouse imaged using conventional fluorescence microscopy through a cranial window. The region of interest marked by the yellow dashed box was imaged by TPM in (C) and dual-wavelength OR-PAM in (D), respectively. In (D), amyloid plaques are colored blue and blood vessels are colored yellow. Arrows indicate plaques. All scale bars are 100 μm. Excerpted from (Hu et al., 2009c).

