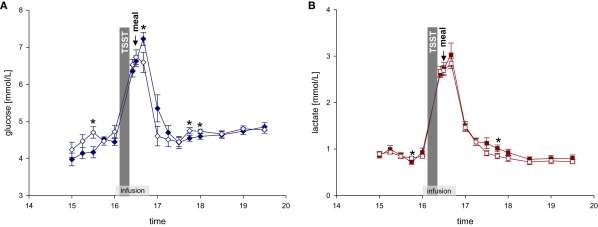
Figure 2.
(A) Glucose concentrations during stress and non-stress intervention in 10 men applied a dextrose infusion. (B) Lactate concentrations during stress and non-stress intervention in 10 men applied a lactate infusion. Values are means ± SEM; closed symbols, stress intervention and open symbols, non-stress intervention. *P < 0.05, significantly different from non-stress intervention, by dependent t-test.

