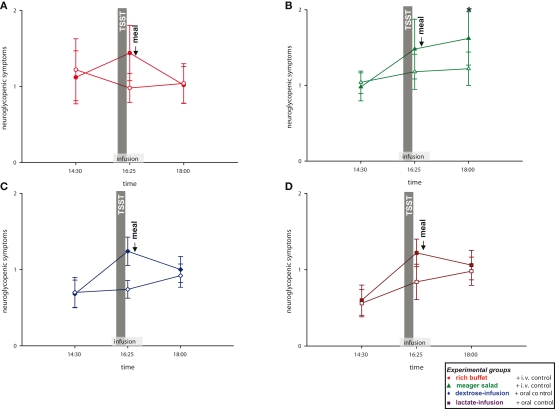
Figure 6.
Neuroglycopenic symptoms during stress and non-stress intervention in all four experimental groups. Original scale of neuroglycopenic symptoms ranges from 0 to 9. Legends as in Figure 2; *P < 0.05, significantly different from non-stress intervention, by dependent t-test.

