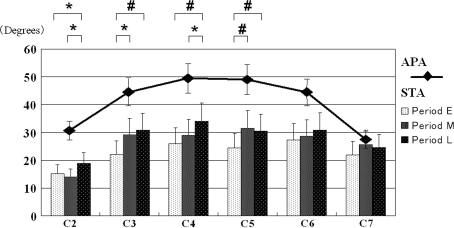
Fig. 3.
Anatomical pedicle angles (APA) and screw trajectory angles (STA) of each vertebra in each period. The mean STA of each vertebra in each period were represented by a bar graph. The mean APA in each vertebra was superimposed by a line graph. Note a tendency to show larger STA in the later period than those of earlier period. The symbols # and * are P values <0.01 and those <0.05 in Fischer’s PLSD, respectively

