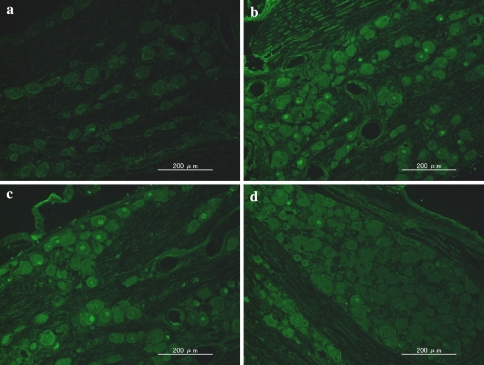
Fig. 3.
Photomicrographs show ATF-3 expression in the control group (a), herniation only group (b), herniation ± oligo group (c), and herniation ± NF-κB decoy group (d). The ratio of ATF-3 immunoreactive neurons in the herniation + NF-κB group was significantly less than those in the herniation only and herniation + oligo groups (P < 0.05)

