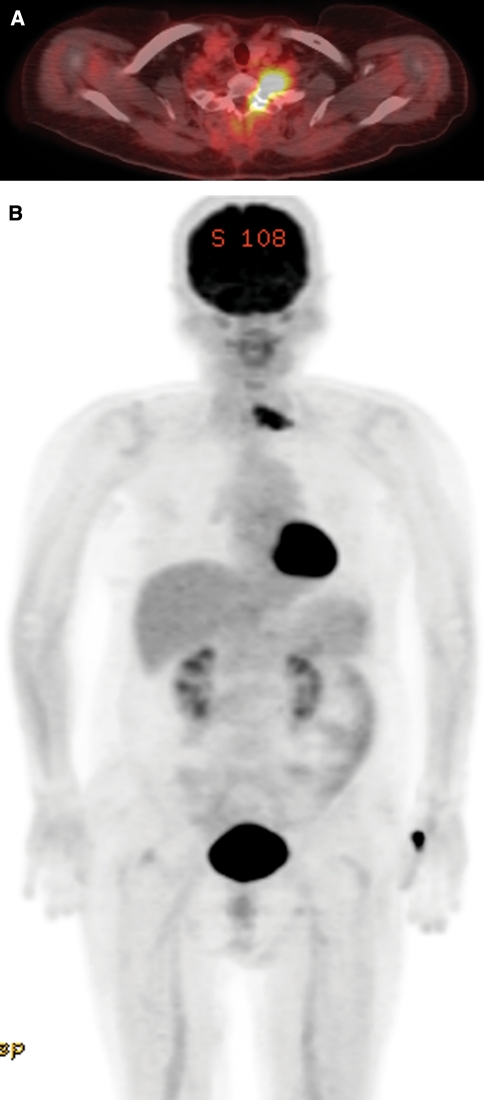
Fig. 3.
PET/CT results. a Transverse fused PET/CT image shows intense FDG uptake in the mass of the left neural foramen at the level of C6–7. b Coronal maximum intensity projection image demonstrates FDG uptake at the tumor site, without abnormal uptake at other sites in the body. Normal physiologic intense FDG activity is seen in the brain, myocardium, and bladder. Note also the focal high accumulation of FDG in the left thumb region of the site of FDG injection

