FIGURE 3.

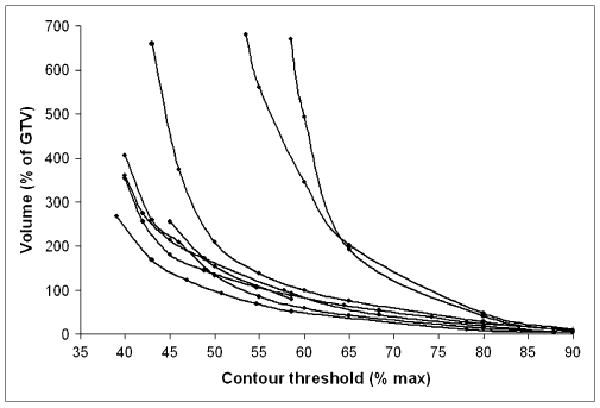
Size of GTV vs. threshold level of 18F-FDG PET signal chosen for automatic contouring. Volumes are plotted as percentage relative to CT-based volume. Data are shown for 8 patients with head and neck cancer.

Size of GTV vs. threshold level of 18F-FDG PET signal chosen for automatic contouring. Volumes are plotted as percentage relative to CT-based volume. Data are shown for 8 patients with head and neck cancer.