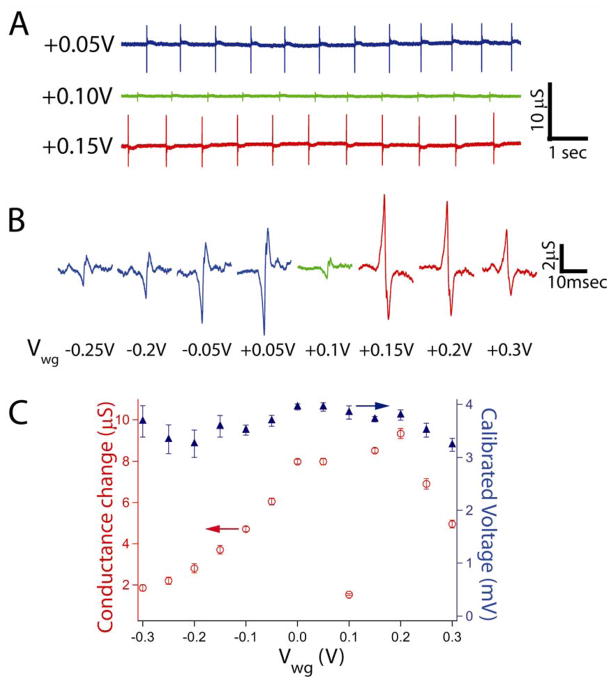
Figure 3. Gate effect on Gra-FET recorded signals from cardiomyocytes.
(A) Recorded traces at different applied water gate potentials. The following traces blue, green and red were recorded at +0.05, +0.10 and +0.15 V, respectively. The corresponding sensitivities are 2020, 398, and 2290 μS/V, respectively. (B) Representative expanded peaks for selected gate potentials. Blue resembles traces that were recorded at the p-type polarity of the graphene FET and red peaks represent recorded traces at the n-type device polarity, and green peaks were recorded near the Dirac point of Gra-FET. (C) Summary table of the gate potential effect. Red open circles are the recorded conductance changes average ± 1SD, blue close triangle are the calibrated voltages for each of the corresponding gate potentials (average ± 1SD).

