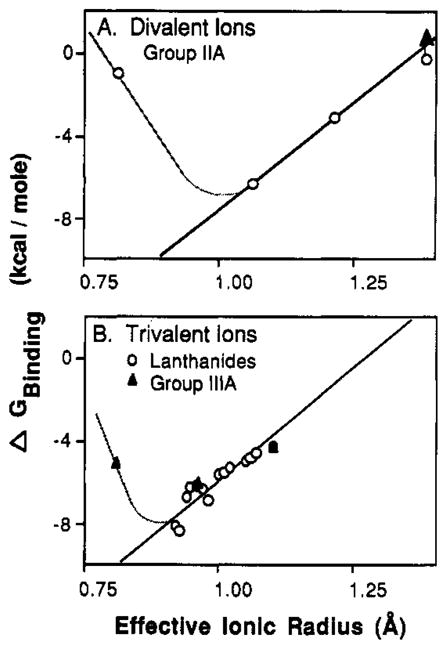
FIGURE 5.

Dependence of binding free energy on metal ion size and charge. Plotted against effective ionic radius are the binding free energies, or the lower limit binding free energy (up arrow), for the spherical metal ions listed in Table I. Also shown are least-squares best-fit straight lines for radii larger than the optimal radii (bold lines) and hypothetical curves extending to radii smaller than the optimum (light lines). (A) Divalent metal ions from group IIA exhibit a best-fit slope of 21 kcal/mol per angstrom above the optimum. (B) Trivalent metal ions from group IIIA and the lanthanides exhibit a best-fit slope of 19 kcal/mol per angstrom above the optimum.
