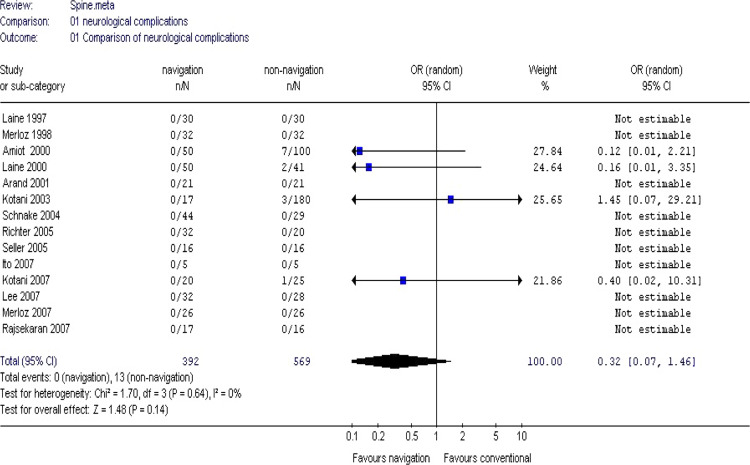
Fig. 1.
Forest plot showing neurological complications in comparative trials. Individual studies are plotted on y-axis with a summary estimate at the bottom. The point estimates (blue squares) are shown on a line that represents their associated 95% confidence interval. The odds ratio (OR) is shown towards the right of the diagram with the pooled estimate calculated with the random-effects model at the bottom. The pooled estimate suggests that risk of neurological complications decreases with navigation

