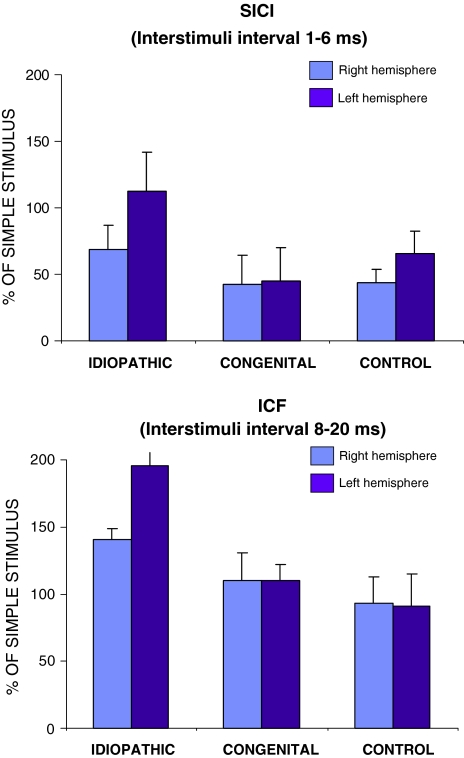
Fig. 2.
Short-latency intracortical inhibition (SICI) and ICF in right and left hemispheres in the three groups of subjects. Bars average area under the curve of the MEPs normalized to the responses to the test stimuli alone. The clear hemispheric asymmetry in the idiopathic scoliosis patients for both SICI (P = 0.006) and ICF (P = 0.01)

