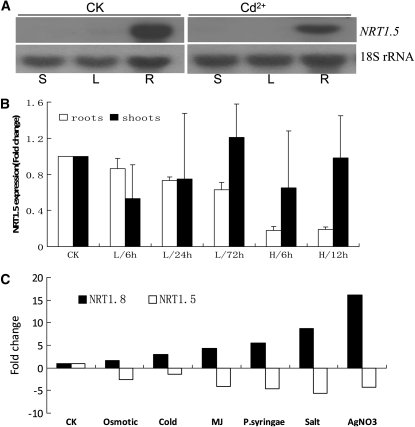
Figure 10.
Opposite Regulation of NRT1.8 and NRT1.5 Expression under Stress Conditions.
(A) Four-week-old plants were exposed to 200 μM Cd2+ for 6 h or were kept under control conditions (CK). NRT1.5 expression was determined in stems (S), rosette leaves (L), and roots (R) by RNA gel blots. 18S rRNA was used as a loading control.
(B) Quantitative RT-PCR of NRT1.5 expression in plants treated with 20 μM (L) or 200 μM (H) Cd2+ for the indicated times. n = 3, and values are mean ± sd. Fold change compared with control (CK) is shown.
(C) Expression data of NRT1.8/At4g21680 and NRT1.5/At1g32450 were obtained from Genevestigator (Zimmermann et al., 2004). Examples representing the following stresses were selected: osmotic (mannitol), cold (low temperature), MJ (methyl jasmonate), P.syringae (Pseudomonas syringae), salt (NaCl), and heavy metal (AgNO3). Fold change compared with control (CK) is shown. Detailed information and more data are available from Genevestigator (https://www.genevestigator.com/gv/index.jsp).

