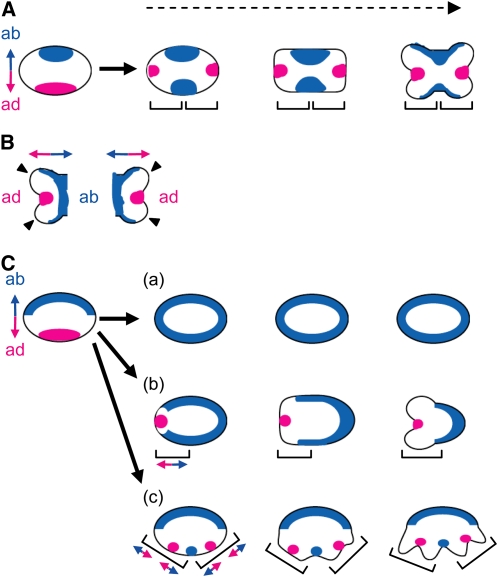
Figure 7.
Model of Anther Patterning in Rice.
(A) Model of anther patterning in the wild type.
(B) Adaxial-abaxial polarity in a theca. Arrowheads indicate the protrusions at the region between the domains of the adaxial and abaxial identities.
(C) Model of anther patterning in rol. (a) Pin-like stamen, (b) OT-type stamen, and (c) ATT-type stamen. The domains with the adaxial and abaxial identities represented by the expression domains of ETT1 and PHB3 are shown in red and blue, respectively. Each bracket represents a unit of the adaxial-abaxial polarity. Double-headed arrows represent the axis of adaxial-abaxial polarity. ab, abaxial side; ad, adaxial side. Dashed arrow indicates developmental progression.

