
Fig. 2.
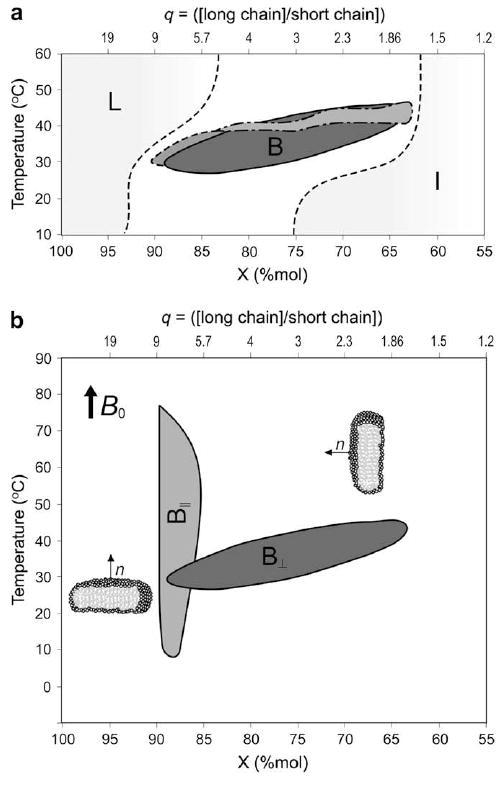
(a) Temperature–composition diagrams of bicelle systems containing saturated fatty acyl chains: ester lipids DMPC/DCPC (solid line —, dark gray), DPPC/DHPC (dashed line - - -, gray) and ether lipids DiOMPC/DiOHPC (dashed line -.-.-, gray), in 80% (w/w) D2O, as determined from orientational properties by phosphorus NMR. Shaded areas indicate the lamellar (L) and the isotropic phase (I, mixed micelles, isotropic bicelles). Lines are drawn as eye guides to delineate domains. Adapted from [10,38]. (b) Temperature–composition diagrams of DMPC/DMPC (solid line, light gray area) and TBBPC/DCPC (dashed line, dark gray area) in 80% (w/w) D2O. These lipid mixtures are macroscopically oriented by magnetic fields (B0), either with their bilayer normal, n, perpendicular (B⊥) to the field (DMPC/DCPC) or parallel (B∥, TBBPC/DCPC). Mole fractions X are expressed in percent. q represents the long chain-to-short chain molar ratio. Lines are drawn as eye guides to delineate domains. Adapted from [19].