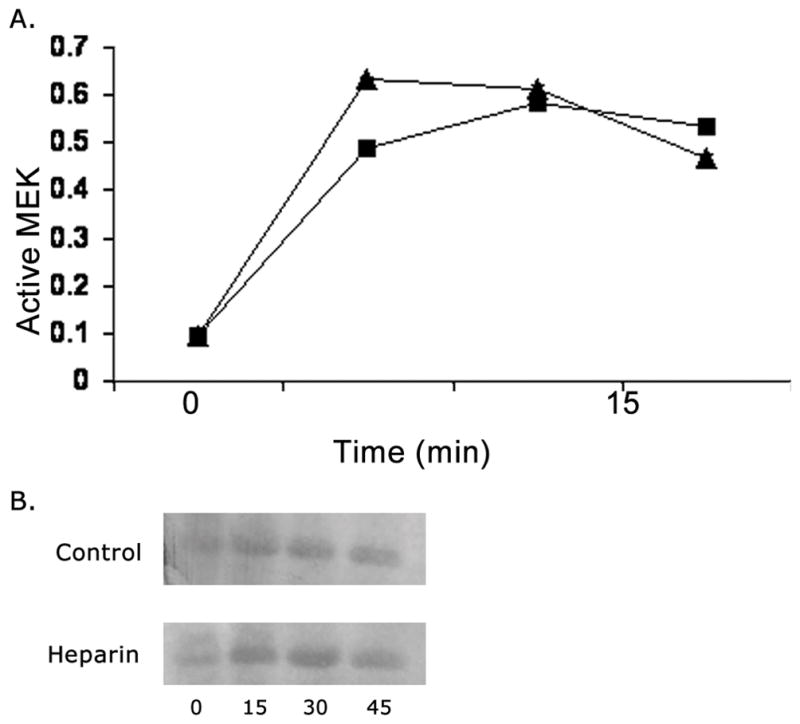
Figure 3. Heparin effects on active MEK.

Panel A: A7r5 cells were grown, starved, untreated or treated with 100 μg/ml heparin, activated with PMA and analyzed by Western blotting using an antibody against active MEK. Squares indicate heparin treated cells, while triangles show data from cells not treated with heparin. The time starts with PMA addition. Each point is the average from three experiments, error bars fall within the data points. Panel B: Experiments identical to those in panel A were carried out with porcine VSMCs, but using serum for activation. A representative blot is illustrated.
