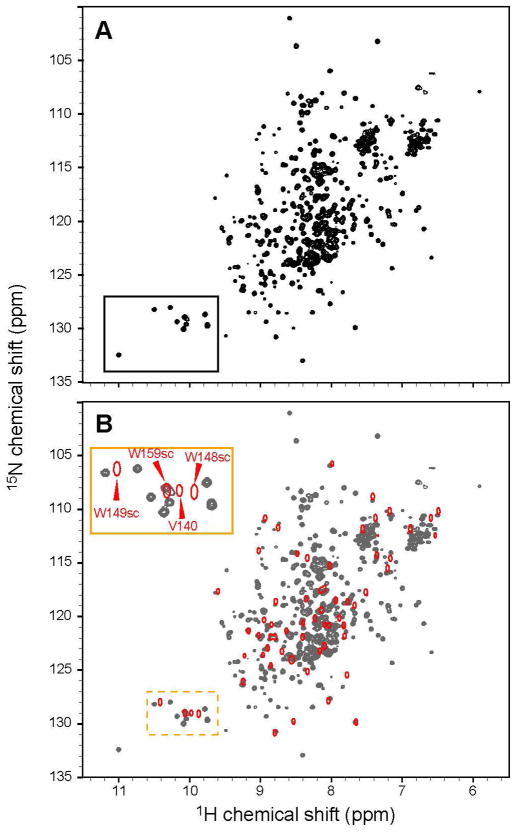
Figure 1.
Comparison of 1H15N HSQC spectra of Nck-FL and isolated SH3.2. (A) 1H15N HSQC spectrum of 100 μM [ul-2H15N] Nck-FL. (B) 1H15N HSQC spectrum of 100 μM [ul-15N] Nck SH3.2 (Red contour) was overlaid to that of [ul-2H15N] Nck-FL (Gray). The region containing the tryptophan indole signals is enlarged in the insert and the assignments are indicated (“sc” stands for Trp sidechain indole signals).

