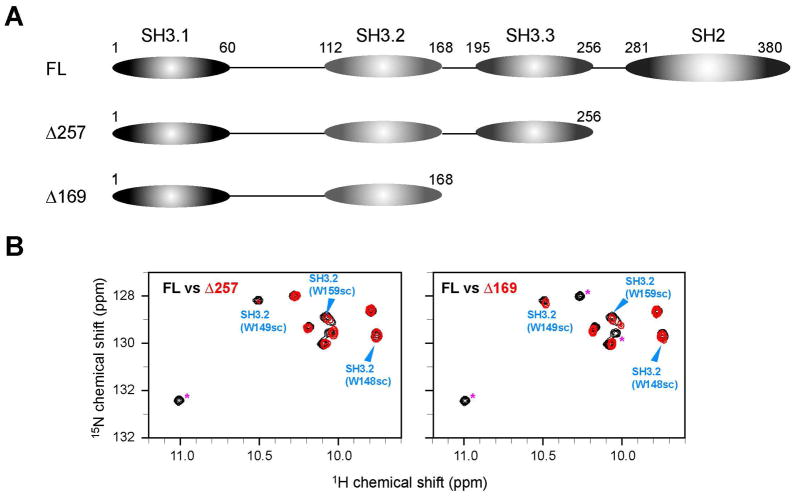
Figure 2.
C-terminal deletion constructs of Nck2 (A) Schematic representation of C-terminal deletion constructs of Nck2 (B) Comparison of 1H15N HSQC spectrum between 100 μM [ul-2H15N] Nck-FL and 100 μM [ul-2H15N] Nck Δ257 (left, red contour) or [ul-2H15N] Nck Δ169 (right, red contour). The region containing the tryptophan indole signals is shown. Arrowheads with assignments indicate the tryptophan indole signals from SH3.2 domains. Signals from SH2 domain are indicated with asterisk in Δ257 spectrum. In Δ169 spectrum SH2 and SH3.2 domain signals are indicated with asterisk.

