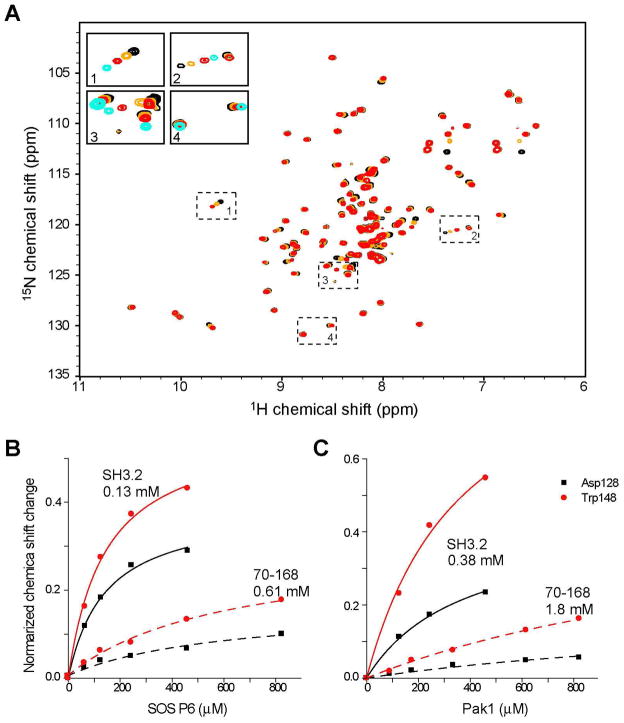
Figure 6.
Titration of the PRS peptides to isolated SH3.2 domain. (A) Titration of the SOS1 peptide to 130 μM [ul-15N] Nck 70–168. The 1H15N HSQC of free state (black), as well as with 130 μM (orange) and 830 μM of (red) SOS peptide. The four dotted regions in the HSQC spectrum are enlarged and shown in inserted panels. In the inserted figures, 1H15N HSQC spectrum of 130 μM [ul-15N] Nck SH3.2 with 830 μM of SOS peptide is also shown in cyan. (B and C) Concentration dependent chemical shift changes induced by (B) SOS and (C) Pak1 peptides. Chemical shifts are normalized as in Figure 4. Chemical shift changes for Asp128 and Trp148 with fast exchanges are shown. Kd values that were calculated from the concentration dependent chemical shift changes are also shown in the figure.

