
Figure 3.
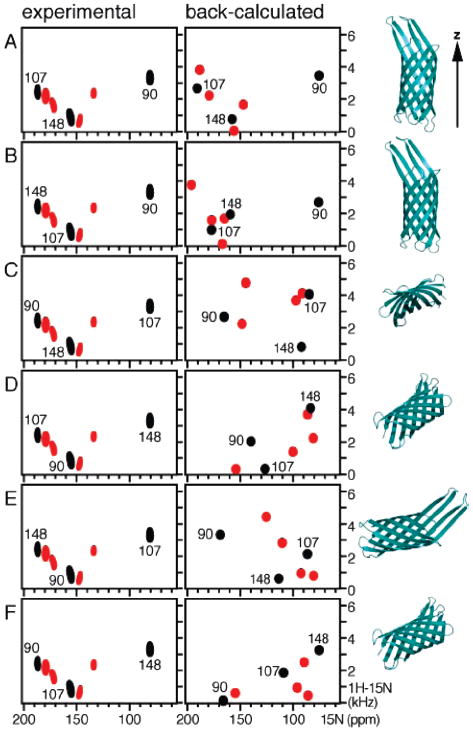
Test assignments generated for six possible ways (A–F) of distributing three Phe labels (F90, F107, and F148) among three peaks, shown in black to indicate that they disappear in D2O; peaks in red persist in D2O. For each test assignment, the experimental spectrum is shown at the left, the spectrum back-calculated after rigid-body simulated annealing with the three dipolar coupling restraints is shown in the center, and the corresponding orientations of the OmpX coordinates are shown at the right. The Z axis shown at the top is parallel to the membrane normal and the magnetic field.