
Figure 5.
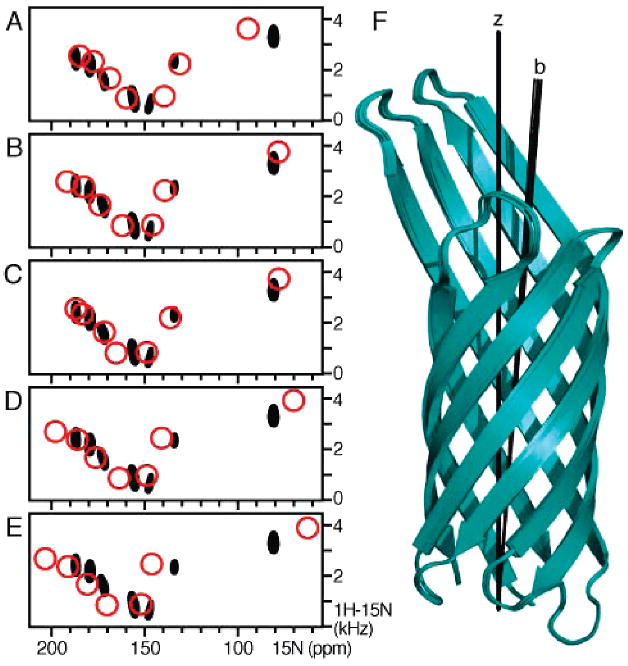
Effect of varying the bicelle order parameter, Szz, on the Phe SLF spectra calculated in the final simulated annealing step with the seven resonance assignments. The experimental spectrum is colored black. The spectra shown as red circles were calculated with the following values: (A) Szz = 0.7 and Da = 7.36; (B and C) Szz = 0.8 and Da = 8.41; (D) Szz = 0.9 and Da = 9.47; and (E) Szz = 1.0 and Da = 10.52. The orientation-dependent chemical shift frequencies were obtained from the back-calculated chemical shift anisotropies using a δiso of 125 ppm, except in panel C where the residue-specific values of δiso measured from the HSQC spectrum of OmpX in micelles were used. The overall (dipolar coupling + chemical shift) rmsds between experimental and calculated frequencies were (A) 0.030, (B) 0.021, (C) 0.022, (D) 0.031, and (E) 0.049. (F) Overlay of the coordinates obtained for each value of Szz, corresponding to the spectra in panels A–E. The barrel axes (b) adopt a similar tilt relative to the membrane normal and magnetic field (Z).