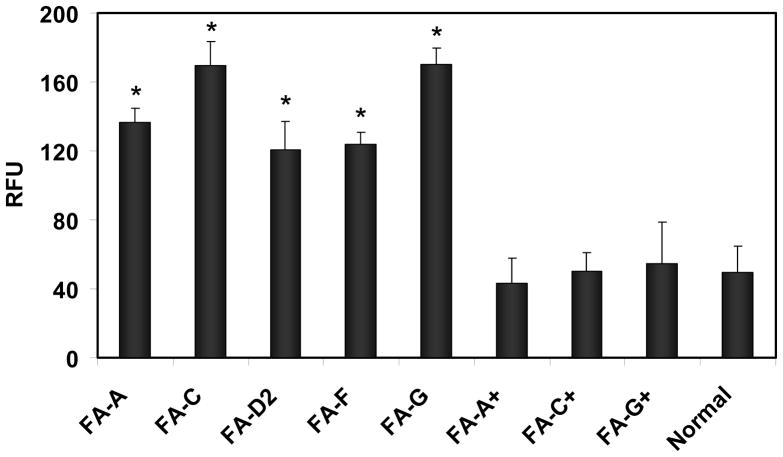
FIGURE 1.
Calpain activity in FA cells is greater than in corrected FA cells or normal cells. Calpain activity was measured in chromatin-associated protein extracts from FA-A, FA-C, FA-D2, FA-F and FA-G cells and from corrected FA-A (FA-A+), FA-C (FA-C+), and FA-G (FAG+) and compared with this activity from normal cells. Activity was determined by measuring cleavage of a fluorogenic substrate and expressed as relative fluorescence units (RFU). Vertical lines represent ± s.e.m. for 5–8 experiments (p <0.0001).

