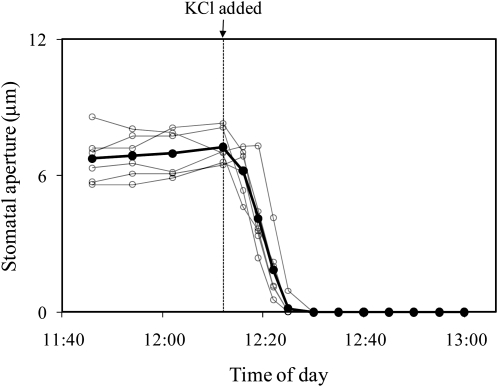
Figure 5.
Stomatal response to a 50 mm KCl solution that was microinjected into the intercellular air spaces of a T. pallida leaf. White circles represent individual stomata on a single leaf; black symbols represent their average. Results are for a single experiment; the experiment was repeated twice with similar results.

