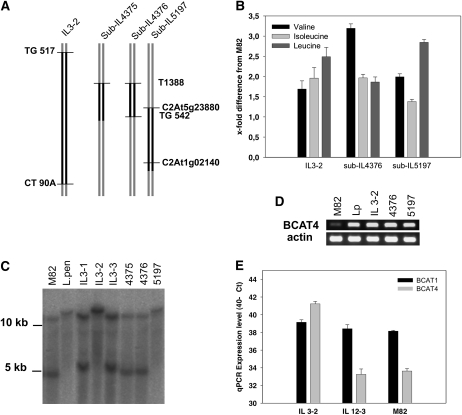
Figure 7.
Mapping of the gene encoding SlBCAT4 and characterization of respective ILs. A, Schematic presentation of the introgressed region. B, Analysis of BCAA content in fruits by GC-MS. Data represent means ± se from six independent biological replicates. C, DNA-blot analysis of ILs. Ten micrograms of genomic DNA was digested with BfrI restriction enzyme, blotted, and hybridized with radiolabeled gene-specific probe. D, Analysis of the level of expression by RT-PCR. E, qRT-PCR analyses of BCAT1 and BCAT4 transcripts in tomato fruits of S. lycopersicum cv M82 and different ILs. Data represent means ± se from three independent biological replicates with two technical replicates for each point.

