Figure 3.
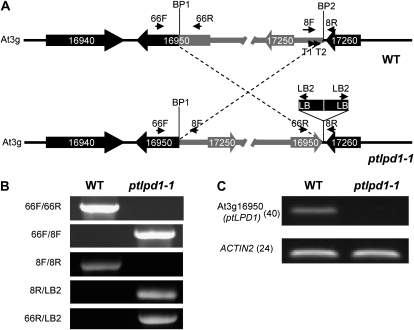
A paracentric inversion underlies the ptlpd1-1 phenotype. A, Schematic representation of the paracentric chromosomal inversion in ptlpd1-1. The top diagram represents the gene organization in the region of wild-type (WT) genomic DNA involved in the inversion event. Genes are represented by thick arrows indicating the direction of transcription. BP1 and BP2 are the break points of the chromosomal inversion. For clarity, the fragment involved in the inversion is shown in gray. The bottom diagram represents the gene arrangement in the ptlpd1-1 mutant. LB represents the left border of the T-DNA in pSKI015. The T-DNA insert is not drawn to scale. Small arrows indicate the annealing sites of primers used to confirm the genome organization. B, PCR-based confirmation of the genomic inversion in ptlpd1-1. Fragments were amplified using the primer pairs indicated on the left and wild-type or ptlpd1-1 mutant genomic DNA as the template. The annealing position of each primer used is shown in A. C, Abundance of At3g16950 (ptLPD1) transcripts in ptlpd1-1 mutant and wild-type seedlings. At3g18780 (ACTIN2) was used as an amplification control. Numbers in parentheses are the numbers of cycles used in the PCR.

