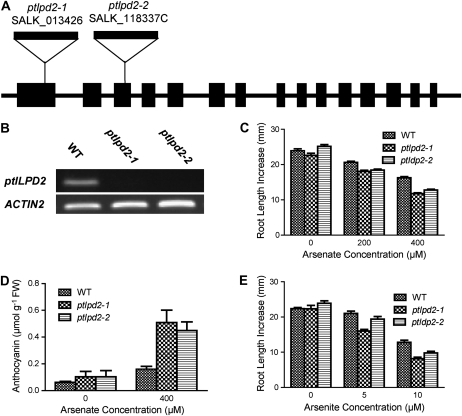
Figure 7.
Response of ptlpd2 mutants to As(V) and As(III). A, Schematic diagram showing the T-DNA insertions in the ptlpd2-1 and ptlpd2-2 alleles of At4g16155. Black boxes and lines represent exons and introns/intergenic regions, respectively, with the direction of transcription being left to right. The size of T-DNA is not drawn to scale. B, Semiquantitative RT-PCR determination of ptLPD2 transcript abundance in plants with the wild-type (WT), ptlpd2-1, or ptlpd2-2 allele. Total RNA was extracted from 5-d-old seedlings and reverse transcribed. ACTIN2 (At3g18780) was used as an amplification control. C and D, Five-day-old seedlings (see legend to Fig. 1) homozygous for wild-type, ptlpd2-1, and ptlpd2-2 alleles were transferred to medium supplemented with As(V). Plants were grown for 4 d with plates in a vertical position, then for 10 d with plates in a horizontal position. C, Root growth was measured 4 d after transfer. Means ± se (n = 15–20 seedlings) are shown. D, Anthocyanin accumulation in the shoots of the wild type and ptlpd2 mutants was determined 14 d after transfer. Means ± se (n = 4 plates; two to four seedlings from a plate were pooled for each replicate) are shown. FW, Fresh weight. E, Root elongation response of ptlpd2-1, ptlpd2-2, and the wild type to As(III). Five-day-old seedlings were transferred to solid medium containing As(III). After 4 d of exposure, the increase in root length was measured. Means ± se (n = 15–20 seedlings) are shown.

