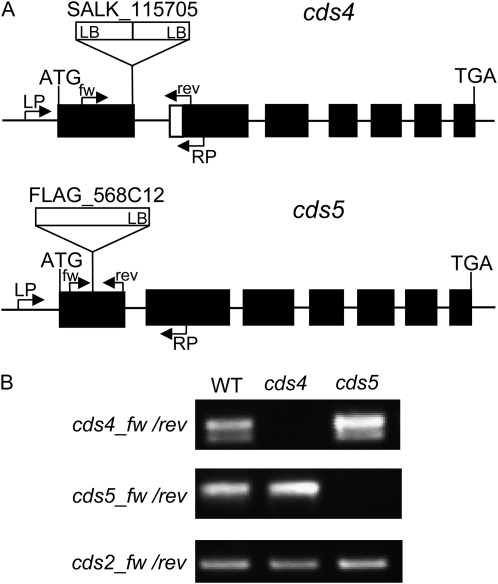
Figure 6.
Analysis of the cds4 and cds5 T-DNA insertion alleles. A, Positions of the T-DNA insertions are indicated relative to the exon-intron structure of CDS genes. Exons are indicated with black bars and introns with thin lines. Primers used for the analysis of the locus (LP and RP) and the respective transcripts (fw and rev) are indicated by arrows. The T-DNAs are shown as white boxes with LB designating the left border. B, Expression of CDS genes in cds4 and cds5 mutants in comparison to the wild type (WT). CDS transcripts were determined by RT-PCR. The lower of the two bands amplified with the CDS4-specific primers is due to the CDS4.2 transcript having a short deletion of 27 nucleotides at the 5′ region of exon 2.

