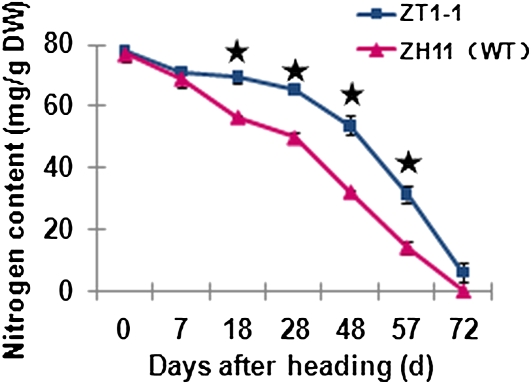
Figure 11.
Analysis of nitrogen content in the flag leaf of wild-type (WT; Zhonghua 11 [ZH11]) and transgenic plants starting 63 d after germination. For each sampling date, the nitrogen content was compared between transgenic and wild-type plants. Asterisks refer to significantly different means of nitrogen content. P < 0.05, tested using Student's t test. Error bars refer to ±se of three replicates, with each replicate being the average of eight to 10 different plants. [See online article for color version of this figure.]

