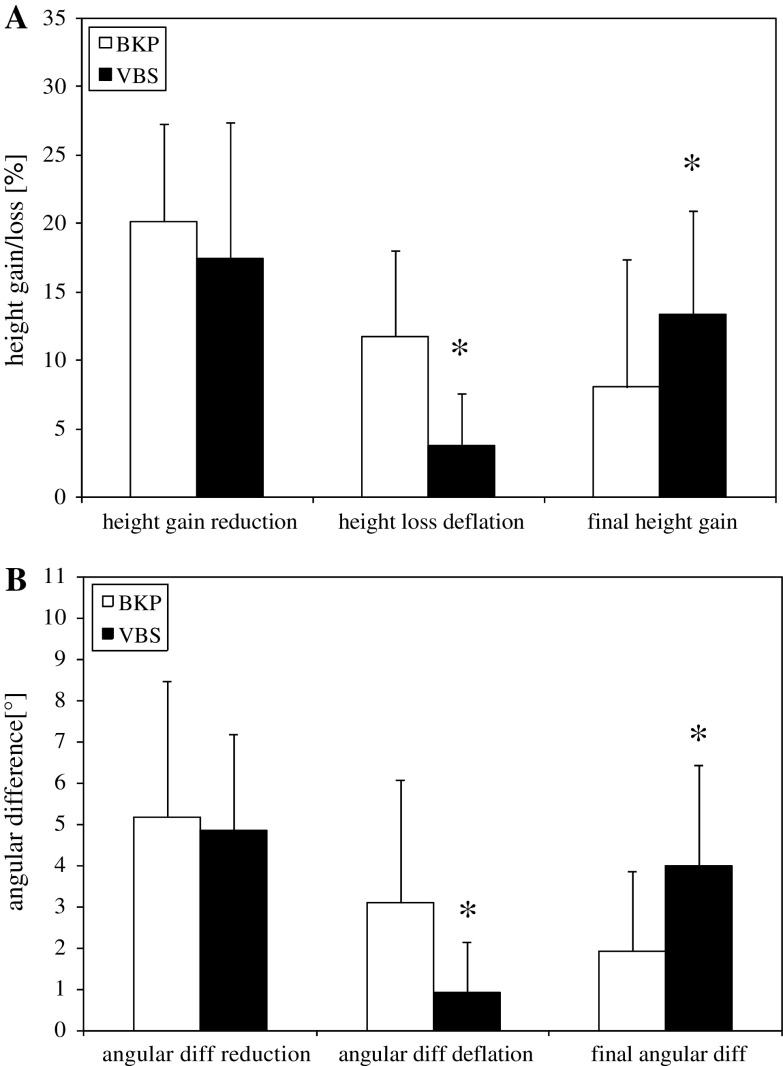
Fig. 3.
Values of the relative height changes in percent (a) and angular changes in degree (b) under a constant preload of 110 N by VBS (filled squares) compared with BKP (open squares) (i) during complete reduction, (ii) after balloon deflation and (iii) resulting height gain/angular change after completion of reduction. Values are given as mean ± SD; ANOVA, post hoc comparison; *p < 0.05 BKP

