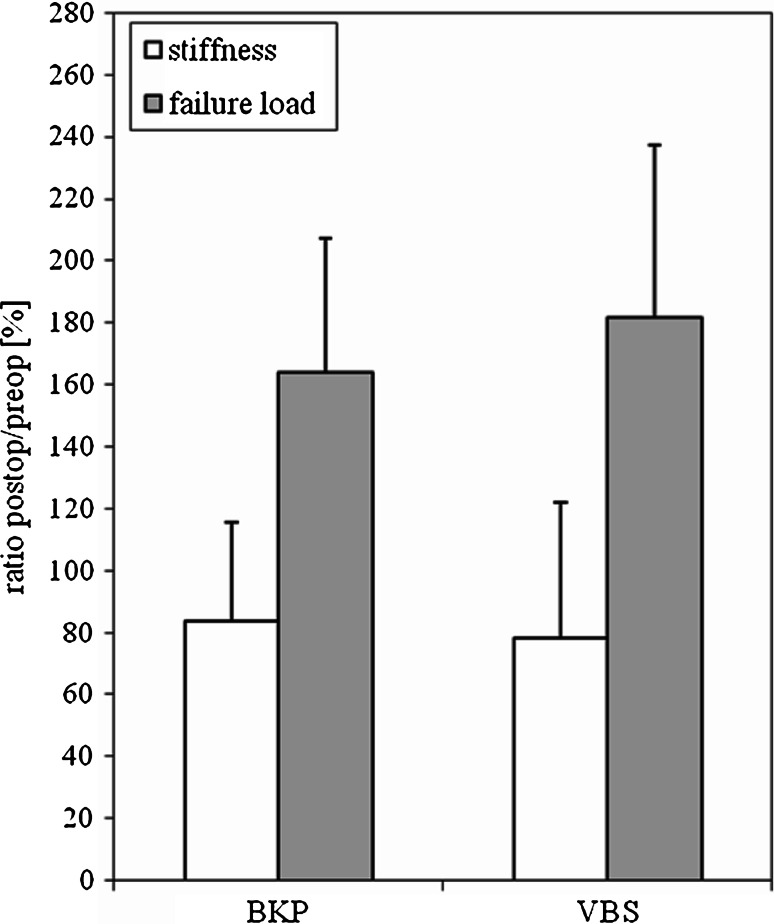
Fig. 5.
Demonstrated are the results of the change in stiffness (open squares) and failure load (filled squares) in percent for BKP and VBS. The pre-operative stiffness and failure load were defined as 100%. The post-operative data were set in relation to the pre-operative values. Values are given as mean ± SD

