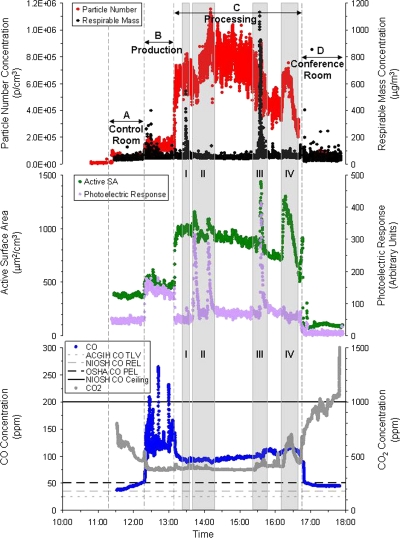
Fig. 4.
Time series of particle number and respirable mass (upper), active surface area and photoelectric potential (center), and CO and CO2 concentrations (lower) at four locations: A, control room; B, production; C, processing; and D, conference room. See floor plan (Fig. 1) for sampling locations. Shaded areas denote specific events in the ‘processing’ area C that resulted in marked increases in one or more monitored metrics. Events were bagging final product (I), opening of dryer (II), dumping dried product (III), and operating gas heater (IV).

