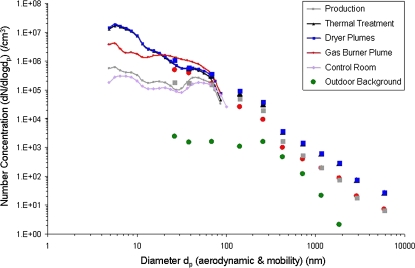
Fig. 6.
Particle size distribution comparison (weighted by number) for ultrafine particle sources at the facility. Measurements were conducted by aerodynamic diameter (ELPI) and mobility equivalent diameter (FPSS). Data from the FPSS were plotted as lines (see legend). For the ELPI, corresponding impactor stages were used and data (geometric mean diameters) plotted as individual points of the same color. A measurement artifact (electrometer offset) influenced FPSS measurements above ∼100 nm, so data were not included.

