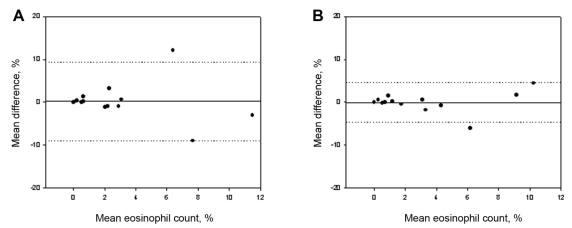
Figure 2).
Bland-Altman plots of mean differences versus mean values of per cent eosinophils show the agreement between samples processed by two different methods. A Per cent eosinophil cell counts from aliquots from the same sample processed by the routine and formaldehyde preservation method. B Per cent eosinophil cell counts from aliquots from the same sample processed by the routine and alcohol preservation methods. The solid line represents the mean difference (see also Tables 1 and 2), the dotted lines indicate ±1.96 SDs from the mean (ie, 95% CIs)

