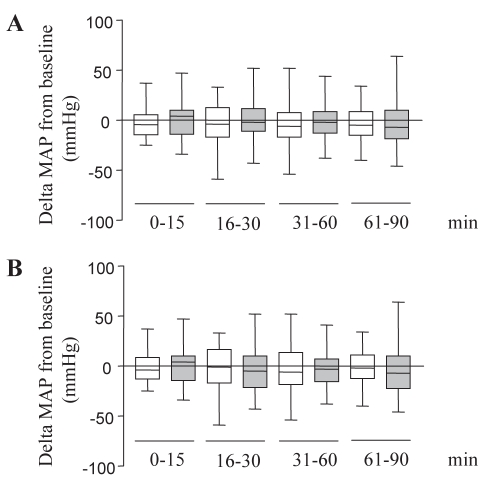
Figure 2).
Serial changes of mean arterial pressure (MAP) during the 90 min time period. Values were pooled into four periods of 15 min for the first two, and 30 min for the final two periods. Data have been expressed as the difference (delta mmHg) of MAP from baseline for each individual. White boxes: zero end-expiratory pressure (ZEEP) patients; grey boxes: positive end-expiratory pressure (PEEP) patients; horizontal line: median; box: interquarttile range; error bars: 10th to 90th percentile range. A All patients included. B Patients without pre-existing hypotension (ZEEP [n=27]; PEEP [n=21])

