
Figure 4.
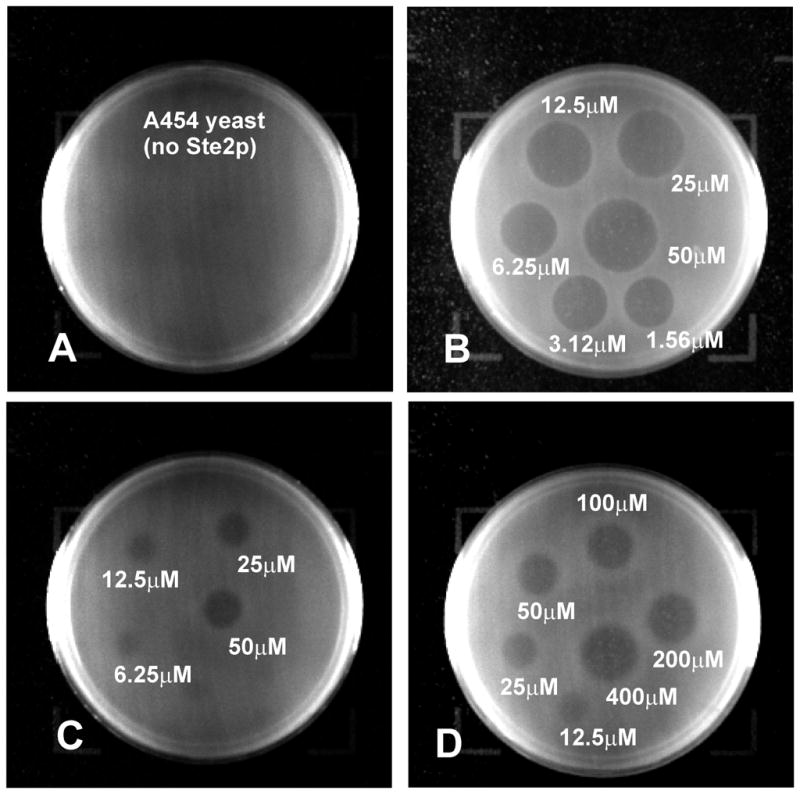
Growth arrest halo assay studied at different pheromone concentrations. (Panel A) [Lys7,Phe13(3,4-F2)]α-factor with yeast strain A454 and ligand concentration ranging from1.56μM to 50μM. (Panel B) [Lys7,Phe13(3,4-F2)]α-factor with yeast strain A3365 and ligand concentration ranging from1.56μM to 50μM. (Panel C) [Lys7,Phe13(2,3,4,5,6-F5)]α-factor with strain A3365 and ligand concentration ranging from 1.56μM to 50μM. (Panel D) [Lys7,Phe13(2,3,4,5,6-F5)]α-factor with strain A3365 and ligand concentration ranging from12.5μM to 400uM.