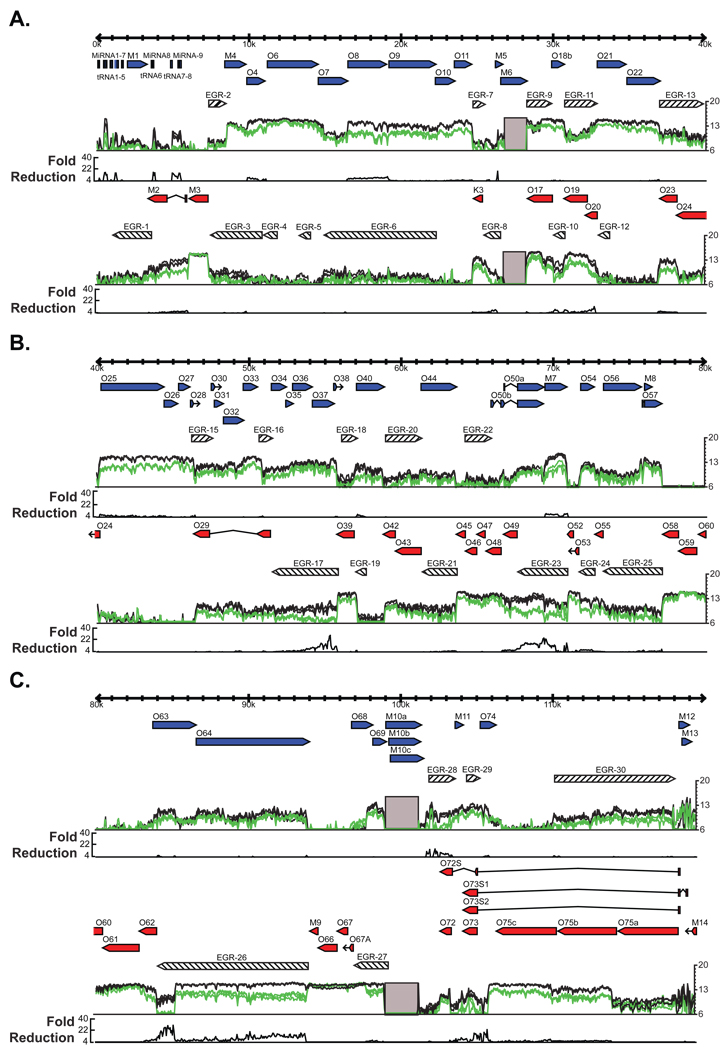
Figure 5. Genome-wide mapping of cidofovir sensitivity.
3T12 cells were infected in the presence, green lines, or absence, black lines, of 42 µg/ml cidofovir and harvested 18 hpi. Three replicates of each condition were performed and are represented as individual lines. Those regions that are greater than 4 fold down regulated in the presence of cidofovir are plotted on a linear scale on a nucleotide-by-nucleotide basis on the black line graph below the transcriptional signal. A) Genomic positions 1–40 kb. B) Genomic positions 40–80 kb. C) Genomic positions 80–119.45 kb. See also Figure S5.

