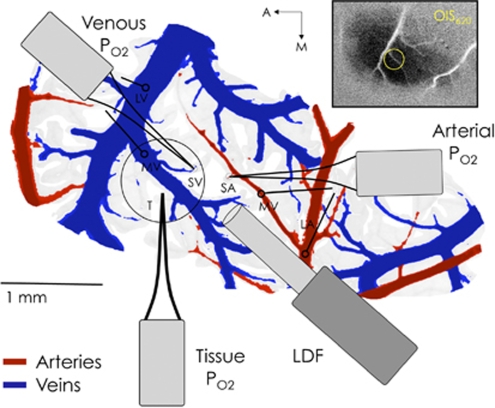
Figure 1.
Sample diagram of the oxygen sensors (PO2) and laser Doppler flowmeter (LDF) probe placement. The blood vessel pattern depicted in this figure was obtained by tracing an image of the surface vessels recorded from this subject. For each experiment in a subject, the arterial and venous PO2 probes were placed on a small pre-penetrating surface artery (SA or SmArt) and a small emerging surface vein (SV or SmVen), respectively, and also in their larger parent vessels; namely, medium artery (MA or MedArt) and medium vein (MV or MedVen), and large artery (LA or LarArt) and large vein (LV or LarVen). The other locations sampled are represented by open circles with lines leading to the appropriate probe that sampled that location. The inset shows the actual average OIS image from which the centroid of activity was calculated.

