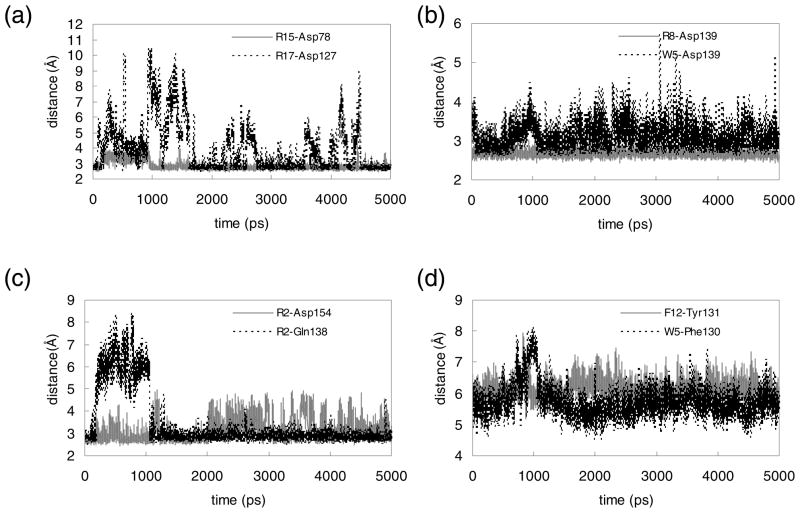
FIGURE 4.
Changes during the 5 ns MD simulation of key intermolecular interactions in the Mth/LR1 complex. Shown are distances (in Å) between side chain heavy atoms. (a) N…O between R15 and Asp78 (gray solid) and between R17 and Asp127 (black dotted), (b) N…O between R8 and Asp139 (gray solid) and between W5 and Asp139 (black dotted), (c) N…O between R2 and Asp154 (gray solid) and N…O between R2 and Gln138 (black dotted), (d) centroid-to-centroid distance between F12 and Tyr131 (gray solid) and W5 and Phe130 (black dotted).

