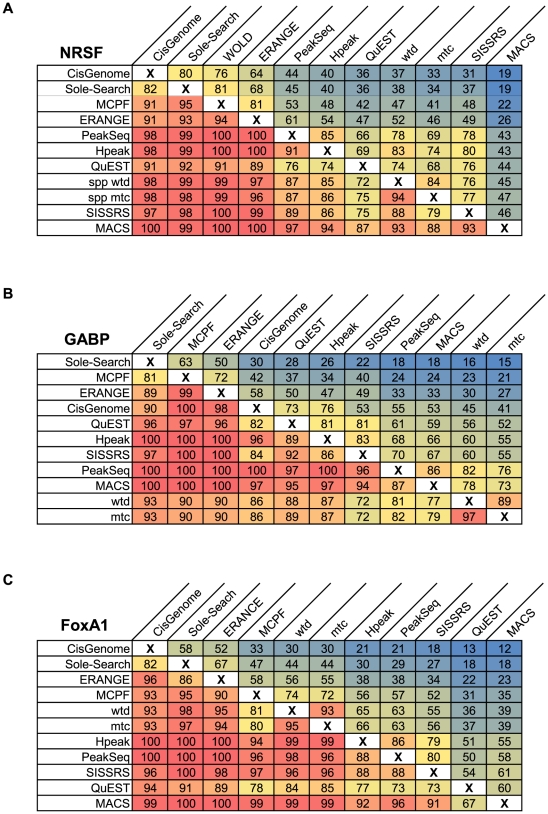
Figure 4. Pair-wise comparison of shared peaks.
Pair-wise comparisons of the peak lists for A) NRSF, B) GABP and C) FoxA1 were conducted to determine the number of shared peaks between each pair of two methods. Each panel shows the percentage of total peaks from one method (column) that shared with another method (row). Programs in rows and columns are sorted by increasing number of peaks and entries are shaded by color gradients such that red represents the highest shared proportion and blue, the lowest.

