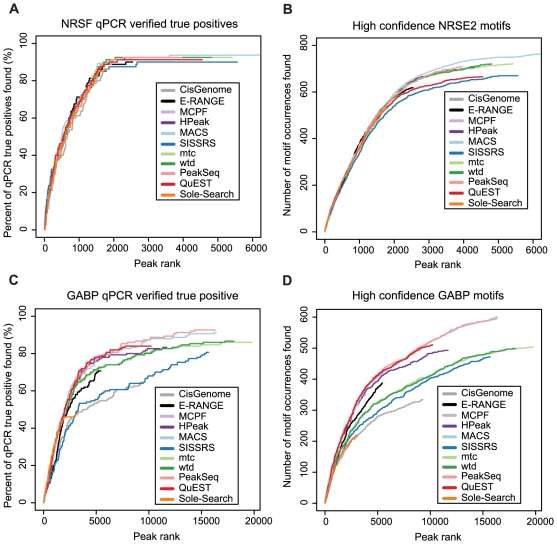
Figure 5. Sensitivity assessment.
The percentage of qPCR verified positives that were detected by different programs is shown as a function of the increasing number of ranked peaks examined for the (A) NRSF dataset and its 83 qPCR-verified sites, or (C) the GABP dataset and its 150 qPCR-verified GABP binding sites. qPCR sites were classified as “found” if the center of the sites occurred within 250 bp of a program's predicted binding site (peak summit or peak region center). (B) Coverage of high confidence (FIMO p<1×10⁻⁷) NRSE2 motifs or (D) high confidence (FIMO p<1×10⁻⁶) GABP motifs throughout the human genome as a function of increasing ranked peaks examined. Motif occurrences were covered if the center of the motif occurred within 250 bp of a program's predicted binding site (peak summit or center of peak region).

