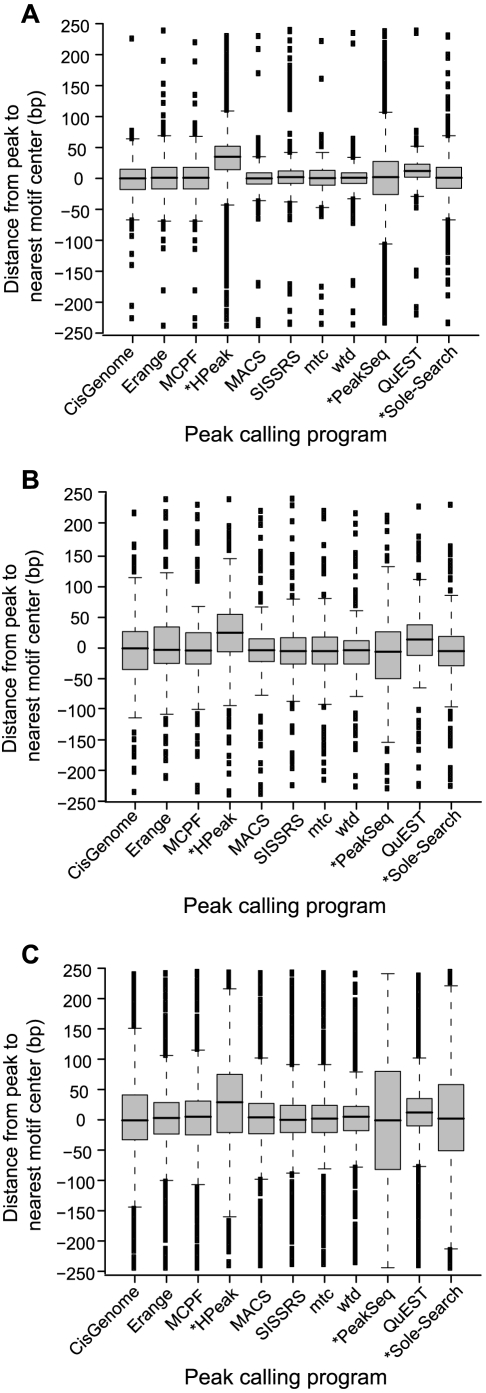
Figure 7. Positional accuracy and precision.
The distance between the predicted binding site and high confidence motif occurrences within 250 bp was calculated for different peak calling programs in the (A) NRSF, (B) FoxA1, and (C) GABP datasets. Negative distances indicate that the motif was found before the peak coordinate (e.g. a motif centered at chr1∶1000 and predicted binding site at chr:1050 corresponds to a distance of −50bp). The variation in distances from predicted binding sites to motif center is presented as a box-and-whisker plot for each program. Starred programs (*) indicate that these methods did not provide a predicted binding coordinate; so binding positions were estimated as the center of the reported peak region. Exact numbers are available in Table S3.

