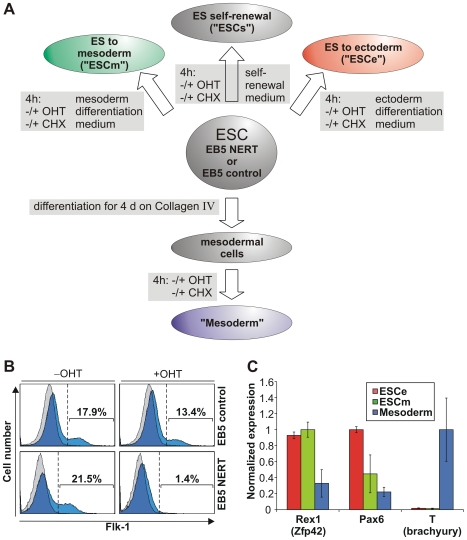
Figure 1. Cell populations used for investigation of Notch1 signaling.
(A) Scheme of cell populations and culture conditions for identification of Notch1 target genes. Undifferentiated EB5 NERT or EB5 control ESC were kept under self-renewal conditions (ESCs) and treated with OHT for 4 h. Alternatively, ESC were cultured in ectodermal differentiation medium (ES to ectoderm; ESCe) or mesodermal differentiation medium (ES to mesoderm; ESCm) during OHT treatment. Furthermore, ESC were differentiated for 4 d on Collagen IV to mesodermal cells (Mesoderm), which were then treated by OHT for 4 h. To distinguish direct from indirect targets, all experiments were additionally performed with or without CHX to inhibit protein synthesis. After 4 h OHT treatment, RNA was extracted from the different cell populations and subjected to further analysis. (B) Mesodermal differentiation of ESC and its suppression by activated Notch1. EB5 control or EB5 NERT cells were cultured for 4.5 d in mesodermal differentiation medium on OP9 stromal cells with or without OHT and the percentage of Flk1+ cells was analyzed by flow cytometry. Histograms of the cells stained with anti-Flk-1 antibody are depicted in blue and histograms of the cells stained with isotype matched mouse IgG are depicted in grey. The area left to the dotted line indicates Flk-1+ cells. The percentage of Flk-1+ cells is shown for each histogram. One representative example of eleven (EB5 NERT cells) or four (EB5 controls cells) experiments is shown, respectively. Reduction of Flk+ positive cells is statistically significant (p<0.01). (C) Expression of Rex1, Pax6, and T (brachyury), which characterize undifferentiated ESC, ectodermal cells and mesodermal cells, respectively, in the cell populations used for array analyses. The different cell types described in A were evaluated for RNA expression of key pluripotency and differentiation genes via microarray analysis. The expression was normalized to the highest mean. Error bars indicate standard deviation. Since Pax6 was identified as a Notch1 target, OHT induced samples were not included for calculation of this gene.

