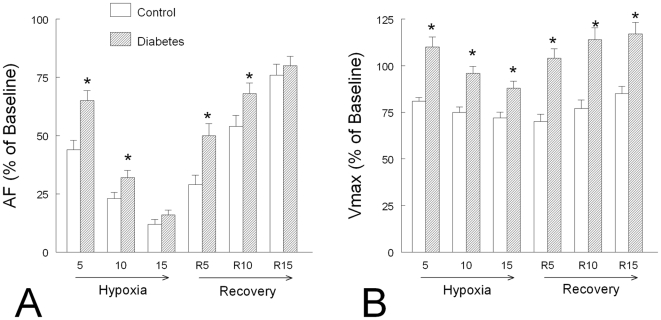
Figure 4. Evolution of main mechanical variables during hypoxia and recovery from hypoxia in control (n = 12) and diabetic (n = 12) rats.
Panel A: AF = isometric active force normalized per cross sectional area (CSA). Panel B: Vmax = maximum shortening velocity. Values are expressed as mean percent of baseline ± SEM. *: P<0.05 versus Control.

