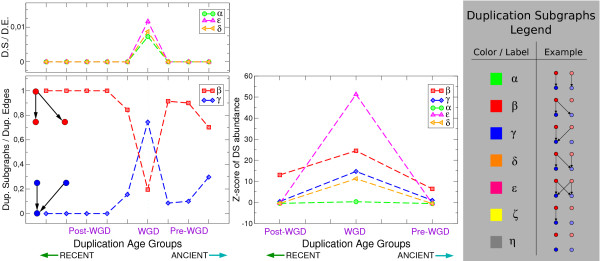
Figure 2.
The DSs stemming from the WGD are significantly different from those emerging from small-scale duplications. Left panel: absolute abundance of DSs (normalized by the total number of duplicated edges, i.e. DSs with two or more links) plotted as a function of duplication age. For this analysis all the duplication age classes of ref. [4] were employed. We have plotted α-, δ- and ε- type DSs on a separate graph (upper left panel) because of the difference in scale. Central panel: plot of the relative DSs abundance with respect to a null model shuffling homology classes vs. duplication age. We considered the Z-score of DS abundance for the grouped pre-WGD, post-WGD and WGD duplication age classes. Both plots show that the trends of DS abundance are distinct for the WGD. Right panel: duplication subgraph legend.

