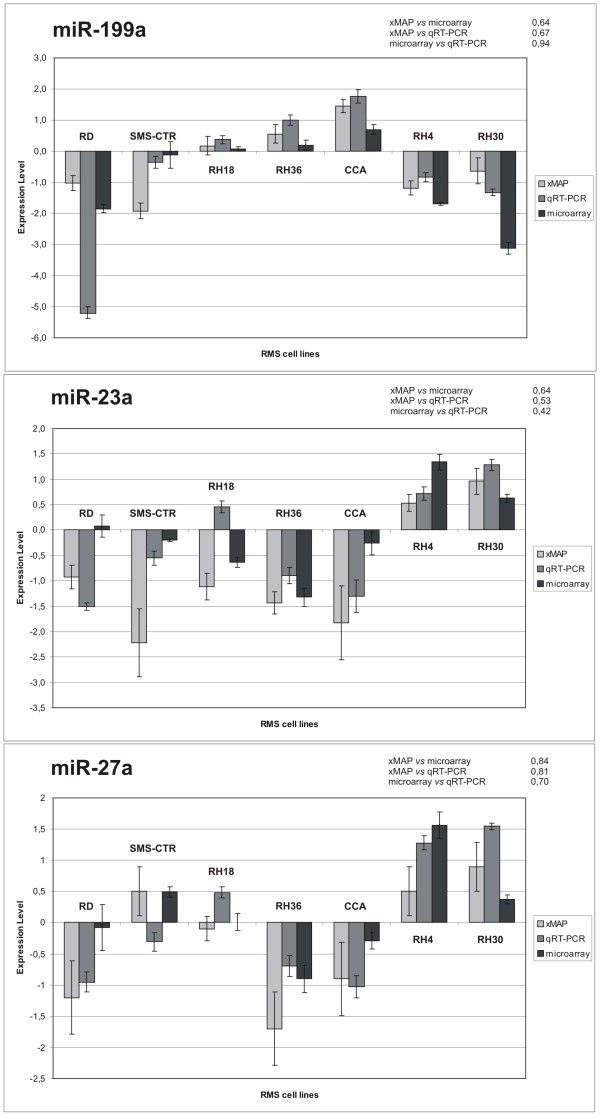
Figure 6.
Comparison of three different techniques used to define miRNA expression profiles in seven RMS cell lines. Expression levels of miR-199a, miR-23a and miR-27a in seven RMS cell lines obtained with three methods (xMAP™, qRT-PCR and microarray) are represented. Mean value of expression and 95% confidence intervals are associated to each miRNA. The Figure also indicate, for each tested miRNAs, non-parametric Spearman correlations for the following paired comparisons: xMAP™ vs. microarray, xMAP™ vs. qRT-PCR and qRT-PCR vs. microarray.

