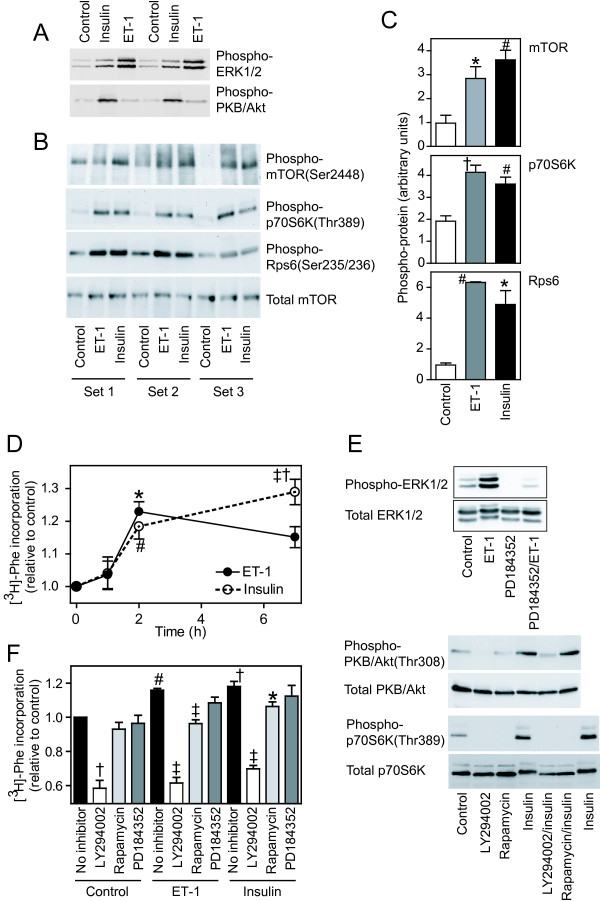
Figure 1.
Protein kinase signaling and regulation of protein synthesis by ET-1 and insulin. Cardiomyocytes were exposed to 100 nM ET-1 or 50 mU/ml insulin or left unstimulated. A-C, Cardiomyocytes were exposed to agonists for 5 min (A) or 15 min (B and C). Protein extracts were immunoblotted with antibodies to phosphorylated ERK1/2 (A, upper panel), phosphorylated PKB/Akt (A, lower panel), phosphorylated mTOR (B, top panel), phosphorylated p70S6k (B, upper center panel), phosphorylated Rps6 (B, lower center panel) or total mTOR (B, lower panel). Each set of samples was prepared from a separate preparation of cardiomyocytes. C, Bands from images in panel B were quantified by scanning densitometry. Results are means ± SEM (n = 3). * p < 0.05, # p < 0.01, † p < 0.001 relative to controls (one-way ANOVA with Tukey post-test). D, Cardiomyocytes were exposed to agonists for the total time indicated and rate of protein synthesis was measured over the last 1 h of incubation using [3H]-Phe. Results are means ± SEM (n = 5 independent preparations of cardiomyocytes). * p < 0.05, # p < 0.01, † p < 0.001 relative to controls, ‡ p < 0.05 relative to 2 h (one-way ANOVA with Tukey post-test). E, Cardiomyocytes were unstimulated (Control) or exposed to agonists/inhibitors as follows: ET-1 (5 min), PD184352 (2 μM, 15 min), PD184352/ET-1 (10 min pretreatment with PD184352 before addition of ET-1 for 5 min), insulin (10 min), LY294002 (50 μM, 20 min), rapamycin (1 μM, 20 min), LY294002/insulin or rapamycin/insulin (10 min pretreatment with inhibitor before addition of insulin for 10 min). Extracts were immunoblotted for phosphorylated and total ERK1/2, PKB/Akt and p70S6K as indicated. Experiments were repeated with similar results. F, Cardiomyocytes were exposed for 2 h to 50 μM LY294005, 1 μM rapamycin, 2 μM PD184352, 100 nM ET-1 or 50 mU/ml insulin, or ET-1 or insulin in the presence of each inhibitor. The rate of protein synthesis was measured over the last 1 h of incubation using [3H]-Phe. Results are means ± SEM (n = 5 independent preparations of cardiomyocytes). # p < 0.01, † p < 0.001 relative to controls, * p < 0.05, ‡ p < 0.001 relative to ET-1 or insulin alone (one-way ANOVA with Tukey post-test).

